
What to check
Return measures the amount paid back relative to stakes. A result can trigger a win animation and still return less than the amount committed. Observing more frequent small awards does not show a higher long-run return.
Compare two sessions with the same budget
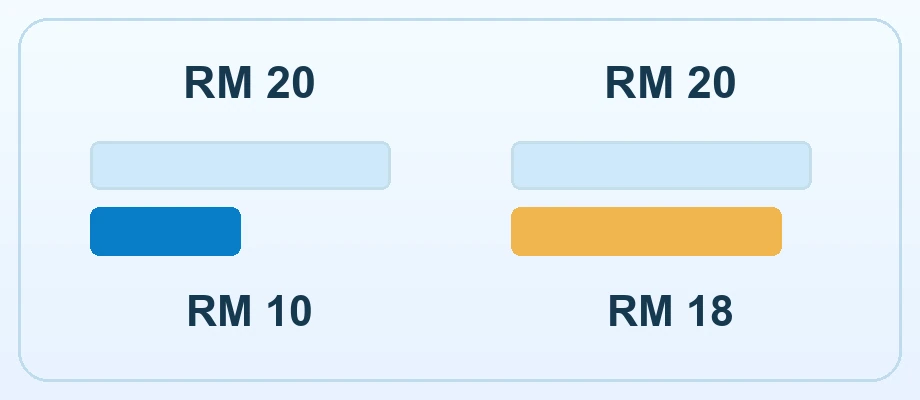
For the same RM20 total stake, a second session could pay only twice but return RM9 each time, leaving a net loss of RM2. The frequency is lower but the short-session return is higher.
Read the full explanation
Neither sample estimates the true game distributions. Repeatable rules and complete records are the inputs for a longer comparison.
Equal hit rates can produce different expected returns
Both examples give a credit with the same frequency. Game A returns an average of half a unit for each unit staked in the model. Game B returns an average of one.
| Illustrative one-unit game | Chance of a credit | Credit when it hits | Expected total return |
|---|---|---|---|
| A | 1 in 4 | 2 units | 0.5 units |
| B | 1 in 4 | 4 units | 1 unit |
Read the full explanation
The expected net values are a loss of half a unit and zero, respectively, before any other costs. The examples have only one paid outcome apiece. A real paytable can have many amounts with different probabilities.
When reading a short session, use actual spend and credit to calculate its net. Use the full payout distribution for an expected-return comparison. The number of positive animations alone cannot provide either measure.
How to use the record
If ten RM2 rounds return RM1 on six of them and nothing on four, the session returned RM6 on RM20 staked and ended RM14 down, even though six outcomes paid. Read theoretical return and game-specific rules separately from that short example. Changing stakes does not turn observed frequency into an advantage.